
Descending Channel Pattern: Trends are an important aspect of the stock market. It represents the collective sentiments and actions of investors and traders. By analyzing trends, individuals can gain insights into market sentiment and predict potential price movements.
One of the prominent tools used in analyzing the trends is the descending channel pattern. In this article, we will understand what is a descending channel pattern and how individuals can trade with it.
What Is A Channel?
A channel is a sort of chart pattern that is formed when there are two lines drawn below and above the price of the securities by joining its high points and low points.
These lines on the chart will be parallel to each other and will represent the levels of support (lower line) and resistance (higher line).
These channels slope upwards, downwards, or sideways and thus are categorized into ascending, descending, and rectangle channel patterns.
When the price of the securities breaks through any of these channels’ price levels, these channels can also represent a change in trend. We will discuss the descending channel pattern in detail here.
What Is A Descending Channel Pattern?
A descending channel pattern is a type of chart pattern that appears during a bearish trend in the market. It is a downward-sloping channel that can be formed by connecting the lower highs and lower lows of the price of security.
This pattern is also referred to as a falling channel pattern or a downward channel pattern. It is considered a bearish pattern as the sellers are pushing the price of the security gradually lower.
This pattern can also be considered a period of consolidation after which the security can give a further breakout in a downward direction or a breakout in the upward direction.
Thus, this pattern can also be used for a bullish reversal, though it is primarily used for a bearish trend in the market.
How To Construct A Descending Channel Pattern?
Forming a descending channel pattern requires security to form two highs and two lows that are consequently lower than the previous price points.
The upper trendline is formed when you connect the two price points that form lower highs and extend the line further ahead in the chart.
The lower trendline is formed when you connect the two points that form lower lows and extend the line further ahead in the chart.
How To Trade Descending Channel Pattern?
There are three in which you can trade descending channel patterns. Here is a detailed explanation of trading the pattern in each way.
Trading With The Swing

When using this trading method, you place a trade when the price is moving inside the descending Channel pattern.
When the price of the security is trading close to the upper trendline (resistance line) of the pattern, one can enter into a short position and square off the position when the price reaches near the lower trendline(support line).
Stop loss for this trade was placed above the pattern’s upper trendline, which serves as resistance.
In a similar way, you can open a long position in a security when the price is close to the lower trendline and square off the position when the price reaches near the upper trendline of the pattern.
Stop loss for this trade was placed below the pattern’s lower trendline, which serves as support.
Breakout On The Downside
When the price of the security crosses below the lower trendline of the pattern, you can enter a short position here. The breakout indicates another significant wave of sellers that will push the security further down.
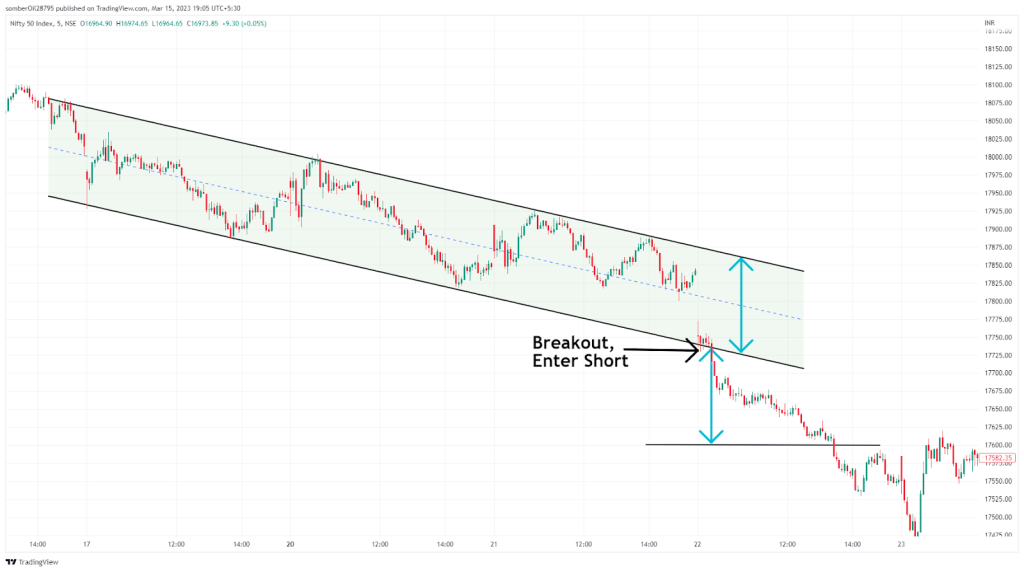
When the security breaches are below the lower trendline, you can initiate a short position in the trade. Now this support line will act as Resistance and will be a zone of Stop Loss for shorts. For this trade, the profit target should match the height of the match.
Breakout On The Upside
When the price of the security crosses above the upper trendline of the pattern, you can enter a long position here. The breakout indicates that the sellers have been exhausted and a new buyer wave has entered the market.
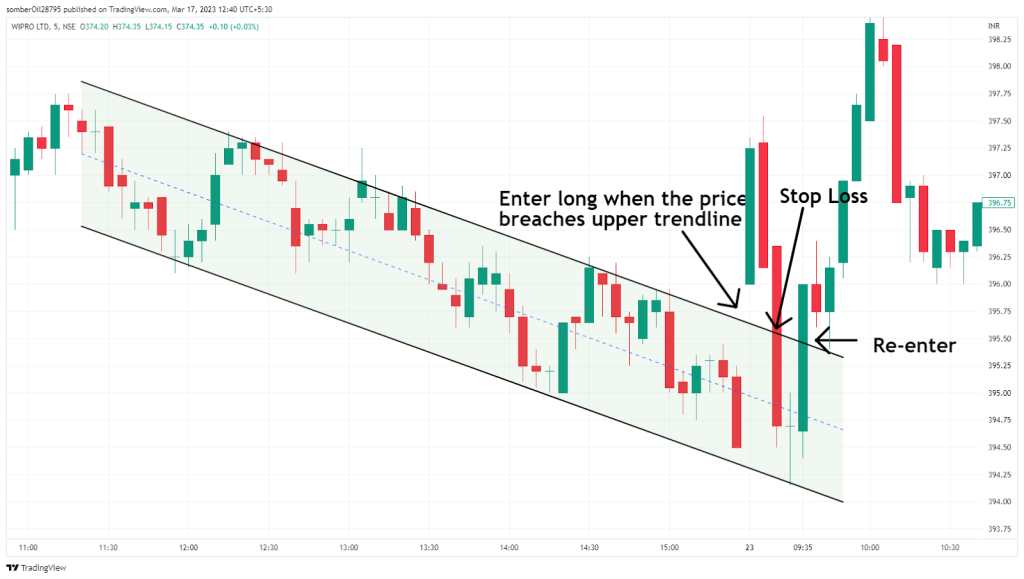
When the security crosses above the upper trendline, you can initiate a long position in the trade using the upper trendline as support and a trigger for stop loss. For this trade, the profit target should match the height of the match.
Also Read: 8 Best Books For Intraday Trading – Top Reads For Beginners!
In Closing
In this article, we discussed what channels are, what is a descending channel pattern, how to construct the channel, and how to trade with it.
The descending channel pattern is a versatile chart pattern that can help individuals gain in various ways in the market.
But since there is a possibility of three different trades with this pattern, it is best to also use technical indicators with the channel in order to get the best trade possible.
Tags: What is a descending channel pattern?, Are descending channels bullish?, Why is a descending channel bullish?, What is downtrending channel pattern?, Descending channel pattern bullish or bearish, Descending channel pattern in downtrend, Ascending channel pattern bullish or bearish, descending channel pattern, Descending Channel Definition, Is A Descending Channel Bullish Or Bearish?