
How To Study Bank Nifty Chart: Stock market indices are statistical measures that are designed to represent the changes in a specific sector or the changes occurring in the entire market. These indices are made up of selective stocks that are picked in such a way that they will represent the situation of the entire sector or market as a whole. Apart from giving an idea about the direction of the market or sector, some of these indices allow you to trade in them. The indices include Nifty 50, Bank Nifty, and Finnifty. Out of these indices, Bank Nifty is the most volatile index you can trade in.
In this article, we will understand what Bank Nifty is and also understand how to study bank nifty chart for the purpose of trading.
What Is Bank Nifty?

Bank Nifty is one of the well-known indices in the Indian Stock Market that gives the representation of the overall performance of the Indian banking sector. The index is made of the most liquid and large-cap Indian banking stocks which include both private and public PSU banks.
The Bank Nifty comprises of 12 most liquid stocks in the banking sector traded on the NSE. The weightage of these stocks is based on the free float market capitalization that derives the total value of the index. The stocks in this index are rebalanced semi-annually where an existing stock in the index might be replaced with a new stock based on the eligibility criteria. Any changes that happen in the values of the index will be available to the market participants on a real-time basis.
Bank Nifty Index was the first index that was made available for trading weekly options, and currently, it is the highly traded security in the Indian market. Having understood the importance of this Index, You must be wondering how to study the bank nifty chart to trade in it. We will give an answer to this question as we move further in this article.
Also Read: What is Bank Nifty? Index That Summarizes Economic Health
How To Study Bank Nifty Chart?
Following are some of the pointers that can help you study the bank nifty chart:
1. Select a Chart Type:
The basic requirement needed to study the charts of Bank Nifty is the chart itself. There are a wide variety of charts one can choose which range from line charts, bar charts, candlestick charts, and Renko charts. Each of these charts has different features and they all have their own set of strengths and weaknesses.
Out of all these charts, the candlestick chart is one of the most commonly used charts by traders as it provides you with more detailed information about price movements and also has better visual appeal.
2. Choosing a Time Frame:
Another important pointer to remember while studying the chart of Bank nifty is the timeframe that you use. Timeframes will range from months to weeks to minutes.
Since Bank Nifty option contracts have a weekly expiry. It is recommended that traders use a shorter timeframe as they help understand the existing trend in the market and take better trade decisions.
Although a shorter timeframe is used to study the direction of the index, the larger timeframes can be used by the traders to plot the support and resistance levels.
If one chooses to trade the bank Nifty through a futures contract, traders should move to a larger timeframe as futures contracts have monthly expiries.
3. Identifying The Support And Resistance Levels:
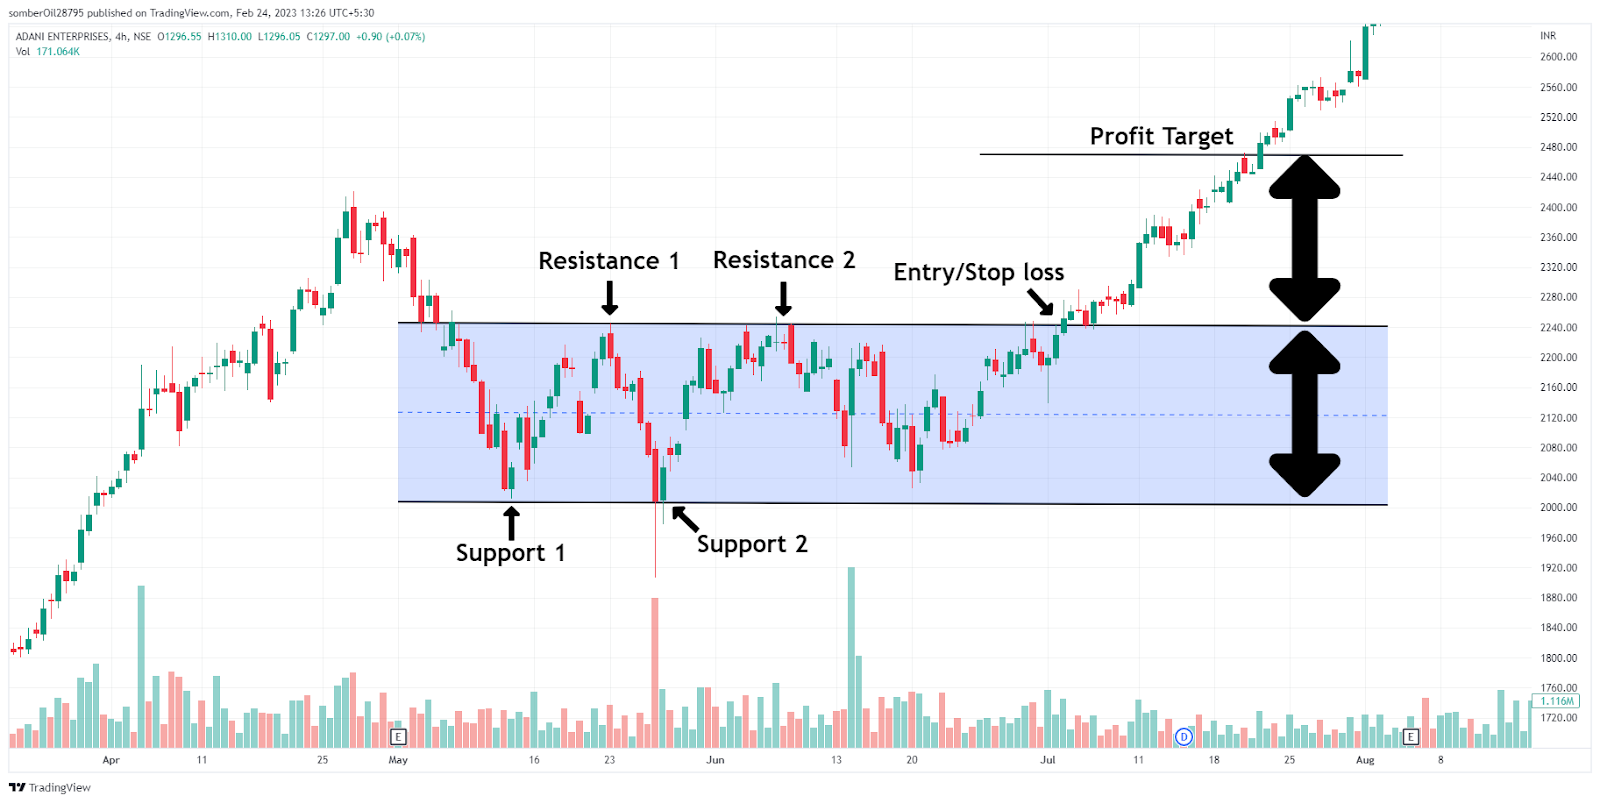
One of the basic yet important concepts while studying the Bank Nifty chart or any other chart for that matter is being able to identify the support and resistance zones. Support and resistance levels are those levels where the price of the security tends to bounce in the opposite direction.
Understanding these levels in the index can help traders identify the levels where they can enter and exit their trades. Also, if Bank Nifty tends to break the level of support or resistance, it can be an indication of a new trend occurring in the market.
The chart below will help you understand how you can use support and resistance levels to study the Bank nifty chart:
4. Understanding The Volumes of The Index:
You can confirm the current market trend with the help of volumes. A trend’s continuation is confirmed by a rise in volume during the trend, and a trend’s reversal may be indicated by a decline in volume throughout the trend.
Since the Bank Nifty can only be bought and sold through futures and options contracts, one should check the volumes and open interest in the futures and options to get an insight into where the index might head in the future.
5. Analyzing Chart Patterns:
Chart patterns are an important part of technical analysis that can help the market participants study Bank Nifty. Chart patterns can be formed with the help of trend lines, support & resistance levels and channels that can help you spot breakouts or breakdowns and forecast the direction in which the index will move.
Here are images that will help you understand how you can use chart patterns to study the Bank nifty chart:
- Analyzing Bank Nifty charts with trendlines:

- Analyzing Bank Nifty charts with channels:

6. Follow News And Events:
News and events also play an important role in the movement of the Bank Nifty Charts. Any news regarding RBI announcements, corporate earnings of the company, and economic factor which has a relation to the banking sector will lead to volatility in the index.
Keeping a close eye on these events can help market participants get an edge while forecasting the levels of the index.
Also Read: What Is Bank Nifty Pivot Point? Nifty Technical Indicator!
In Closing
In this article, we discussed what Bank Nifty is and How to study Bank Nifty chart. Studying the Bank Nifty chart is crucial to understanding the Indian banking industry. With the combination of technical analysis, fundamental analysis and monitoring news and events, one can get a better idea about the direction in which the index will move in the future.
FAQ:
1. Which indicator is best for bank nifty option trading?
The choice of indicator for Bank Nifty option trading depends on individual trading styles and preferences. However, popular indicators for options trading include the RSI (Relative Strength Index), MACD (Moving Average Convergence Divergence), and Bollinger Bands.
2. Is bank nifty good for intraday?
Yes, Bank Nifty can be a good option for intraday trading due to its high liquidity, volatility, and frequent price movements. However, it is important to have a solid understanding of technical analysis, risk management, and market dynamics to succeed in intraday trading.
3. Which time frame is best for bank nifty?
For intraday trading, the period between 10.15 a.m. to 2.30 p.m. is considered ideal for Bank Nifty, as the volatility generally subsides after 10.00-10.15 a.m.
Tag: How to study bank nifty chart, How can I study Bank Nifty?, How to study Nifty charts?, How does Banknifty chart work?, Bank Nifty chart pattern, bank nifty candle chart, nifty bank candlestick chart, bank nifty candlestick chart, nifty bank candle chart, candlestick pattern bank nifty, What Are the Nifty Charts, How can I learn Nifty chart?, What is the best strategy for Bank Nifty?, Nifty Bank Technical Analysis & Signals, guide to How to study bank nifty chart, learn How to study bank nifty chart, know How to study bank nifty chart, How to study bank nifty chart for beginner, beginner guide to How to study bank nifty chart.