
Discover How to trade in price channels: Trends are an essential aspect of the stock market. It represents the collective sentiments and actions of traders and investors as a whole. By analyzing trends, market participants can gain insights into market sentiment and predict potential price movements. One of the prominent ways of analyzing the trends is through channel patterns.
In this article, we will discuss the different types of price channels and understand how to trade in price channels
What Are Channels?
Channels are a type of chart pattern that helps traders to identify the current trends in the market. A channel pattern is created with the combination of two lines that are parallel to each other. The lower trendline is formed by connecting the lows, or the closing price of the security, and the upper trendline is formed by connecting the highs, or the security’s closing price.
Types Of Channel Patterns:
These channels can be categorized into the following three types:
1. Ascending Channel Pattern:
An ascending channel is a chart pattern that signals a bullish trend in the market. It is an upward-sloping channel created by connecting the security’s higher highs and higher lows.
This pattern can also be viewed as a period of consolidation following which the security will either offer a breakout in an upward or downward direction. Although it is most often used to indicate a bullish trend in the market, this pattern can also be used to indicate a bearish trend.

2. Descending Channel Pattern:
A descending channel is a chart pattern that signals a bearish trend in the market. It is a downward-sloping channel established by connecting the security’s lower highs and lower lows.
Similar to the ascending channel pattern, this pattern can also be viewed as a period of consolidation which can be followed by a breakout in an upward or downward direction. Although it is most often used to indicate a bearish trend in the market, this pattern can also be used to indicate a bullish trend.

3. Horizontal Channel Pattern:
A Horizontal channel is a chart pattern that signals a sideways or consolidating trend in the market. This pattern is formed by connecting the security’s horizontal levels of support and resistance.
This pattern works best for a bullish breakout when the consolidation occurs after a downtrend. Similarly, this pattern works best for a bearish downtrend when the consolidation occurs after an uptrend.

Let us now understand the ways to trade in these channel patterns
How To Trade In Price Channels?
The Ascending Channel Pattern, Descending Channel Pattern and Horizontal Channel Pattern can all be traded similarly. Here are three ways in which one can trade in a price channel.
1. Trading With The Swing:
In this trading approach, a trade is placed when the price of the security is trading within the channel pattern.
When the price of the security is close to the lower trendline of the channel, one can enter a long position in the security. You can square off your position when the price approaches the upper trendline of the security. The stop loss for this trade is set below the channel’s lower trendline which serves as support.
Similarly, you can open a short position in the security when the price is close to the pattern’s upper trendline and square off the position when the price begins to approach the lower trendline. The stop loss for this trade is set below the channel’s upper trendline which serves as resistance.
The following images show you how you can trade in different channels with swings:
- Trading Swings In Ascending Channels:

- Trading Swings In Descending Channels:

- Trading Swings In Horizontal Channels:

Also Read: What is Swing Trading? How is Swing Trading used in Stock Market?
2. Breakout On The Upside:
You can place a trade here when the security price crosses the channel’s upper trendline. The breakout is an indication of a strong wave of buyers entering the security.
You can open a long position in the security when the price crosses above the upper trendline. Here, you use the upper trendline as a support and a trigger for stop loss. The profit target for this pattern should match the height of the channel.
The following images show you how you can trade in different channels during breakouts:
- Breakout Trading In Ascending Channels:

- Breakout Trading In Descending Channels:

- Breakout Trading In Horizontal Channels:

3. A Breakdown From The Channel:
You can place a trade here when the security’s price crosses below the channel’s lower trendline. The breakdown is an indication of a strong wave of sellers entering the security.
You can open a short position in the security when the price crosses below the lower trendline. Here, you use the lower trendline as a resistance and a trigger for stop loss. The profit target for the channel patterns should match the height of the channel.
The following images show you how you can trade in different channels during a breakdown:
- Breakdown Trading In Ascending Channels:
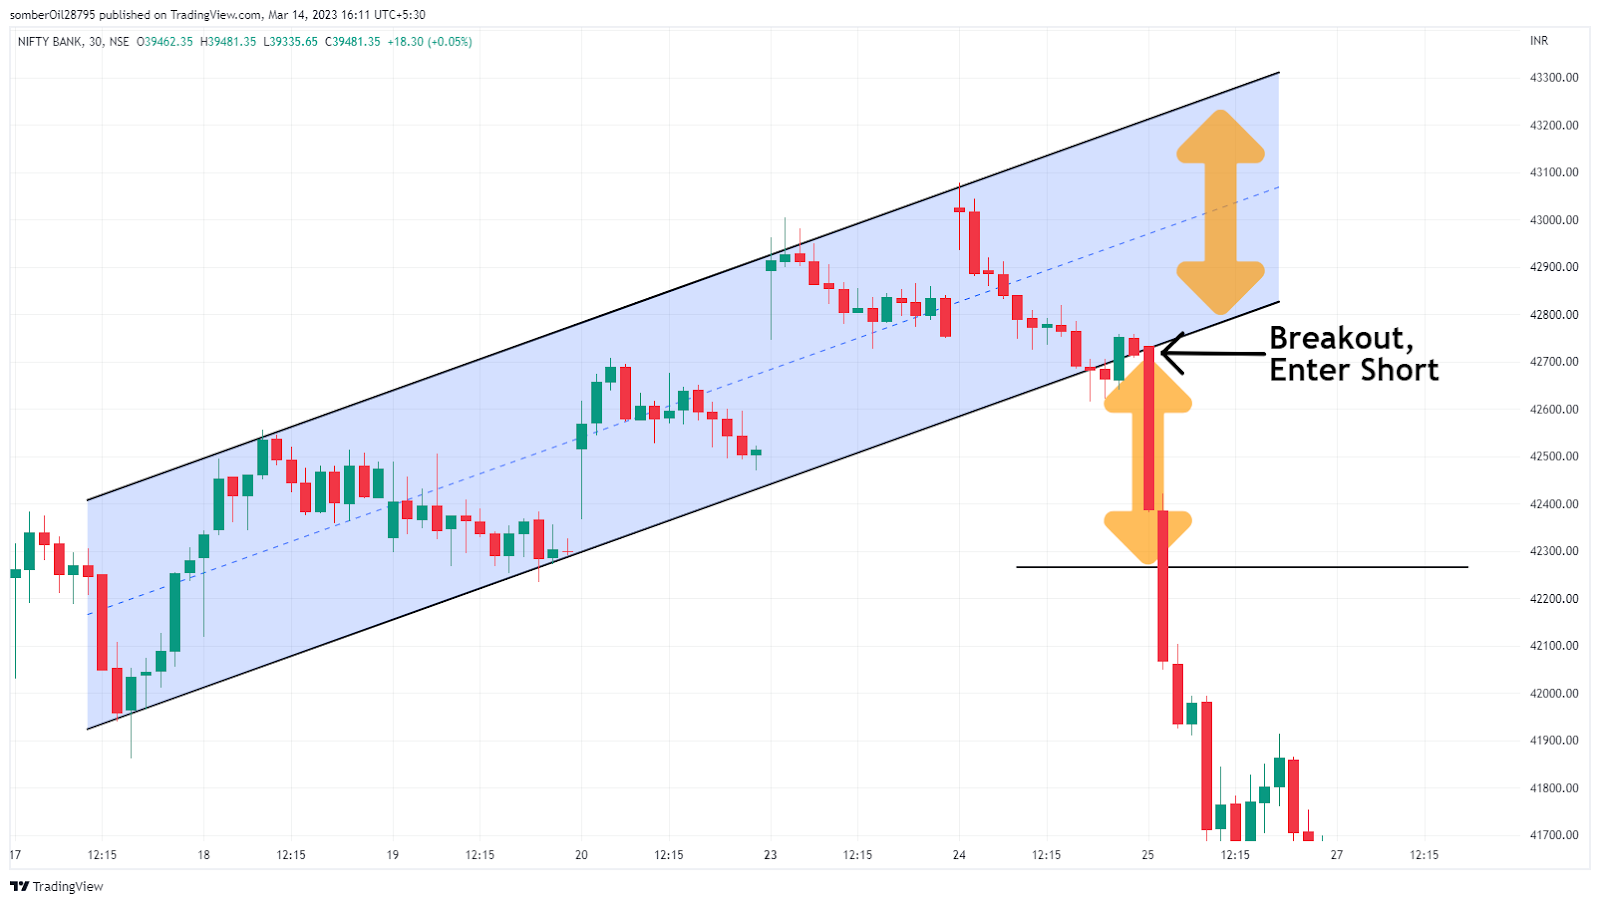
- Breakdown Trading In Descending Channels:

- Breakdown Trading In Descending Channels:

In Closing
In this article, we discussed what are channels and also understand how to trade in price channels.
Channel patterns are versatile chart patterns that can help traders in various ways in the market. But since there is a possibility of three different trades with each of these patterns, it is best to also use technical indicators with the channel to get the best trade possible.
Tag: Types of channel pattern, what are channels, ascending channel pattern, descending channel pattern, horizontal channel pattern, how to trade in price channels, price channels, price channel, how do you trade in channels?, how to trade channel, how to trade channel patterns.